
— Blog
- Data
- Technical
We Ran the Same Construction Scan 20 Times. Here's What Happened.
Nick Haworth · Head of Data & AI · 14 August 2026
Construction teams are increasingly experimenting with large language models (LLMs) on project documents: upload a PDF, paste a prompt, and save the answer. It feels fast, accessible, and cheap.
We wanted to understand how that approach behaves in practice - not as a one-off demo, but as something you might use across a portfolio of projects.
So we ran a controlled experiment.
A note on timing: LLMs move fast, and the models below were current as of this test (August 2026). We're not claiming these results are permanent and are subject to change depending on the model.
At a glance
- Same document, 20 runs each - single-prompt LLM outputs varied widely in volume and focus.
- Coverage was uneven compared with a structured scan pipeline that applies org benchmarks and legislative attribution consistently.
- Re-running the same construction PDF often produces a different picture - treat one-shot LLM output as exploratory, not workflow-ready.
What we set out to learn
We weren't trying to prove that any single model is "bad" or that any product is "perfect." The question was narrower:
If a team uses a general-purpose LLM with a single prompt on the same construction document - and repeats that process - how consistent and complete is the output?
We compared that against DAIV's production scan pipeline on the same construction PDF: document segmentation, organisation benchmark matching, legislative reference retrieval, and structured categorical output.
Each scan run produces tagged items grouped into categories (Scope, Retention, Payment, Security of Payment, and others). Those categories can be correlated back to the organisation's benchmark library, and many items can be attributed to specific legislative references - that's how the structured pipeline is designed to work.
Important caveat upfront: A single-shot chat prompt is not the ceiling of what LLMs can do. Prompts can be refined, broken into steps, paired with retrieval, or wrapped in tooling. This experiment deliberately models a common real-world pattern: one PDF, one prompt, one answer.
The experiment design
Same inputs, many repetitions
We used:
- One construction PDF (the document under review)
- One organisation benchmarks library (the org's internal non-negotiables)
- The same scan instructions for each proprietary LLM run (a single combined prompt referencing org benchmarks and legislative context)
We then ran 20 independent scans per provider on identical inputs.
| Provider | Version tested | Role in experiment |
|---|---|---|
| Gemini | 3.1 Pro | Proprietary LLM + prompt |
| Claude | Sonnet 5 (Medium) | Proprietary LLM + prompt |
| GPT | 5.6 Sol (Instant) | Proprietary LLM + prompt |
| DAIV | Production pipeline | Structured scan pipeline |
Model versions are noted because LLM behaviour changes with each release - this is a point-in-time snapshot, not a permanent verdict on any provider. These were the defaults provided when opting in to a paid subscription.
We did not compare supporting-document cross-checks (minutes, specs, emails) in this round - the construction PDF and org benchmarks library only.
What we measured
For each run we recorded:
- Total tagged items (findings)
- Severity tier (High / Medium / Low)
- Scan track (Org benchmarks vs Legislation)
- Category breakdown
How we analysed the results
We kept the statistics practical and interpretable - the kind of methods you'd use when comparing repeat measurements, not building an academic model.
Distribution and spread. We plotted the distribution of total items across 20 runs per provider using box plots (median, typical spread, and outliers).
Coefficient of variation (CV). CV measures relative consistency: how much results bounce around compared to the average. Lower CV means more repeatable output; higher CV means more volatile output. We applied CV to overall scan volume and to individual categories. CV is widely used in measurement science when comparing variability across groups with different averages (ISO 5725).
Non-parametric statistical tests. With only 20 runs per group, we avoided assuming perfectly normal distributions. We used the Kruskal–Wallis test to compare all four providers, and Mann–Whitney U tests for pairwise comparisons against DAIV, with Bonferroni correction for multiple comparisons.
Category rank stability. For each run we ranked categories by item count and tracked how often each theme appeared as the #1 focus.
What we observed
1. Total volume varied dramatically - especially for prompt-only workflows
| Provider | Avg items / run | Range (20 runs) | Overall CV |
|---|---|---|---|
| DAIV | 79.7 | 73–85 | 3.9% |
| GPT-5.6 | 39.6 | 32–51 | 11.0% |
| Claude S5 | 30.0 | 23–39 | 13.9% |
| Gemini | 13.8 | 10–23 | 23.2% |
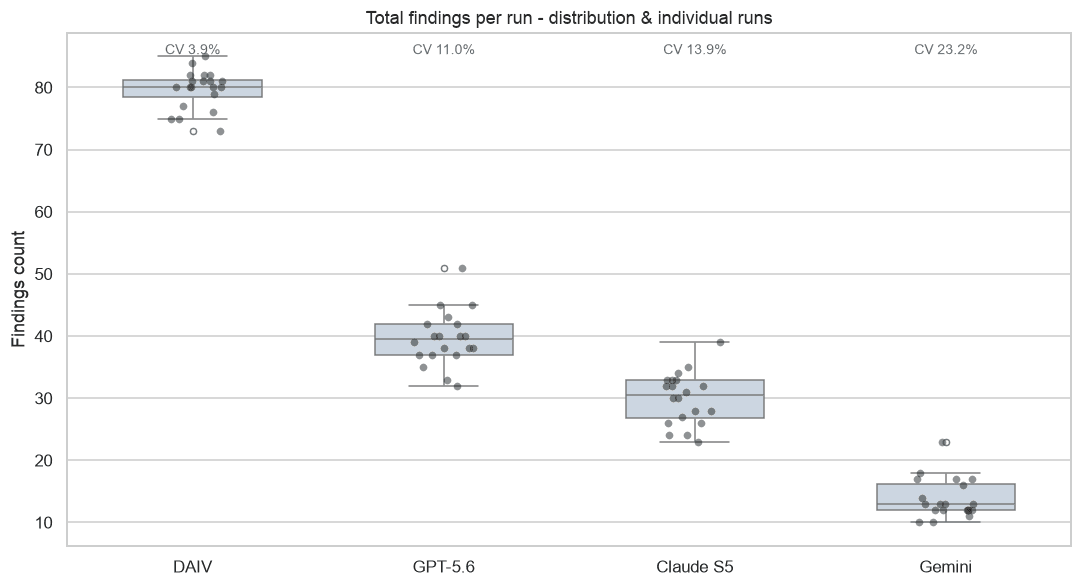
On average, the single-prompt proprietary LLM's produced far fewer tagged items than the structured pipeline - and with wider run-to-run spread. DAIV's pipeline is designed for broad coverage across org-benchmark and legislative tracks, so part of this gap reflects what each approach is built to do, not consistency alone.
The practical point stands either way: if you re-run the same scan tomorrow with a single-prompt approach, you may get a materially different picture.
Mann–Whitney U tests vs DAIV were significant for all three proprietary LLM's after Bonferroni correction (p < 0.001).
2. Org-benchmark and legislative coverage diverged
Breakdown by scan track showed a consistent pattern:
| Provider | Avg org-benchmark items | Avg legislative items |
|---|---|---|
| DAIV | 59.6 | 20.1 |
| GPT-5.6 | 32.7 | 4.3 |
| Claude S5 | 21.2 | 5.2 |
| Gemini | 11.8 | 1.2 |
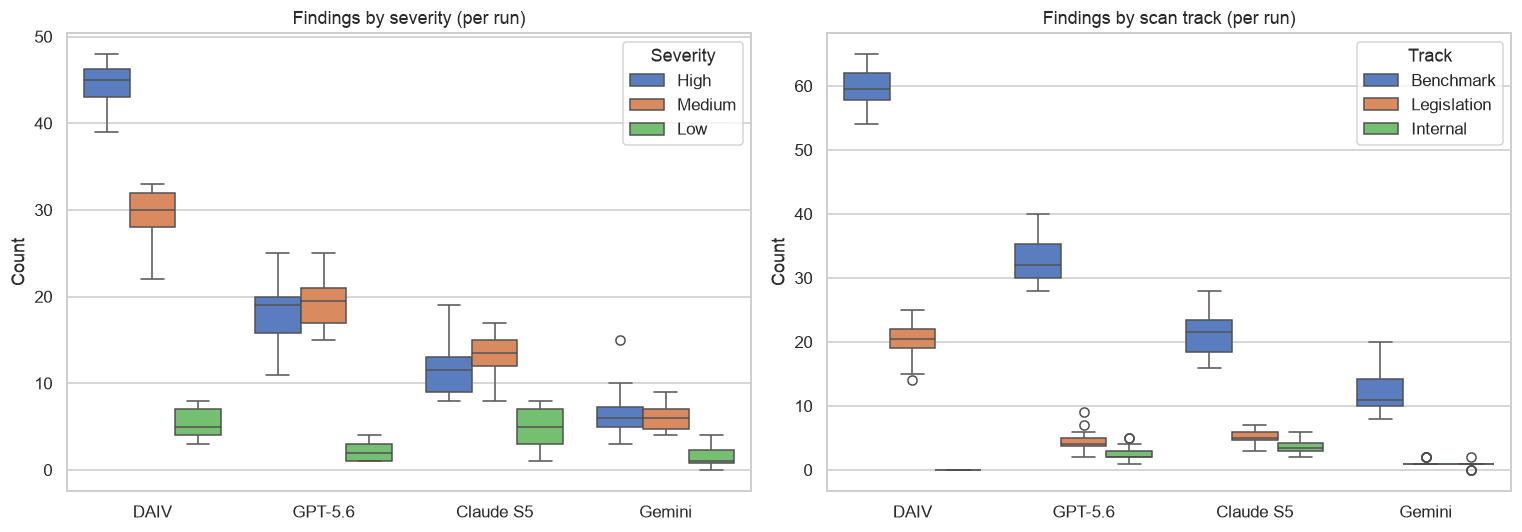
Proprietary LLM runs leaned heavily on one type of scan work. Items attributable to legislative references were often thin compared with the structured pipeline - including areas many organisations treat as fixed requirements, not negotiable points.
3. Category focus was stable for DAIV - shifted for Proprietary LLM's
The structured pipeline's top category across runs was consistent:
- Scope was #1 in 65% of runs
- Retention was #1 in the remaining 35%
Proprietary LLM models showed much less stability:
- GPT-5.6: Programme led 75% of runs; Scope led 20%
- Claude S5: No single dominant theme - "Other" led 40% of runs; five categories each led 10–15%
- Gemini: Payment led 30% of runs; Scope led 5% - other runs emphasised Insurance, Extensions of Time, Limitation of Liability, or mixed categories
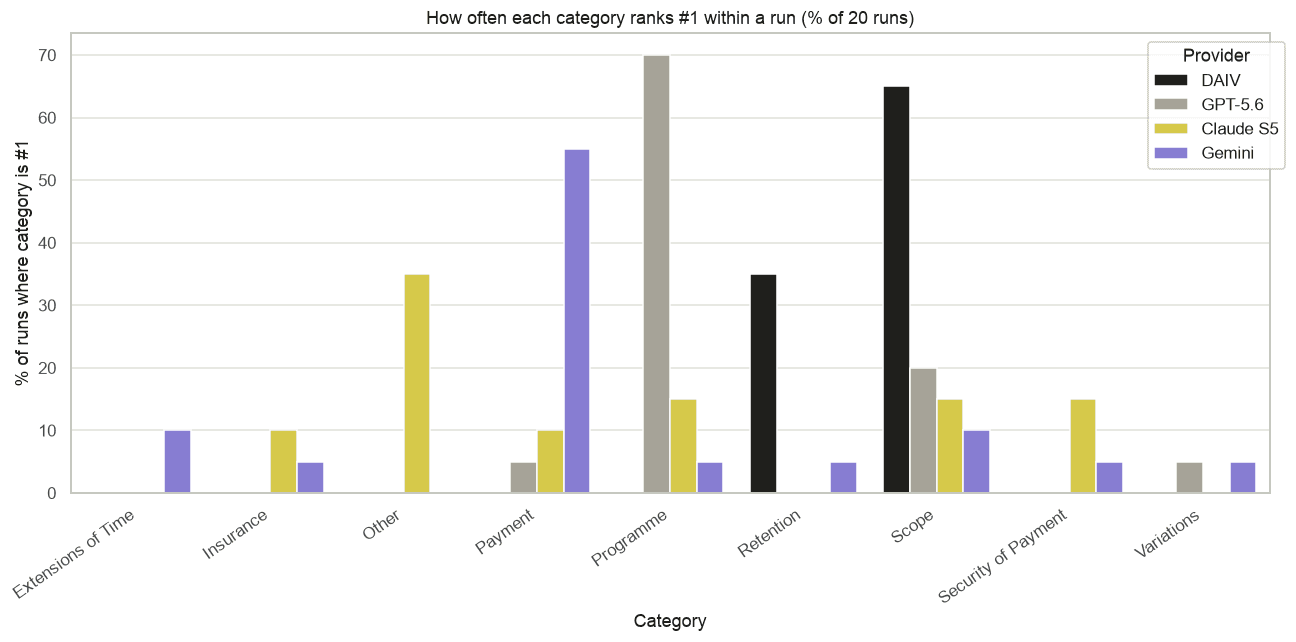
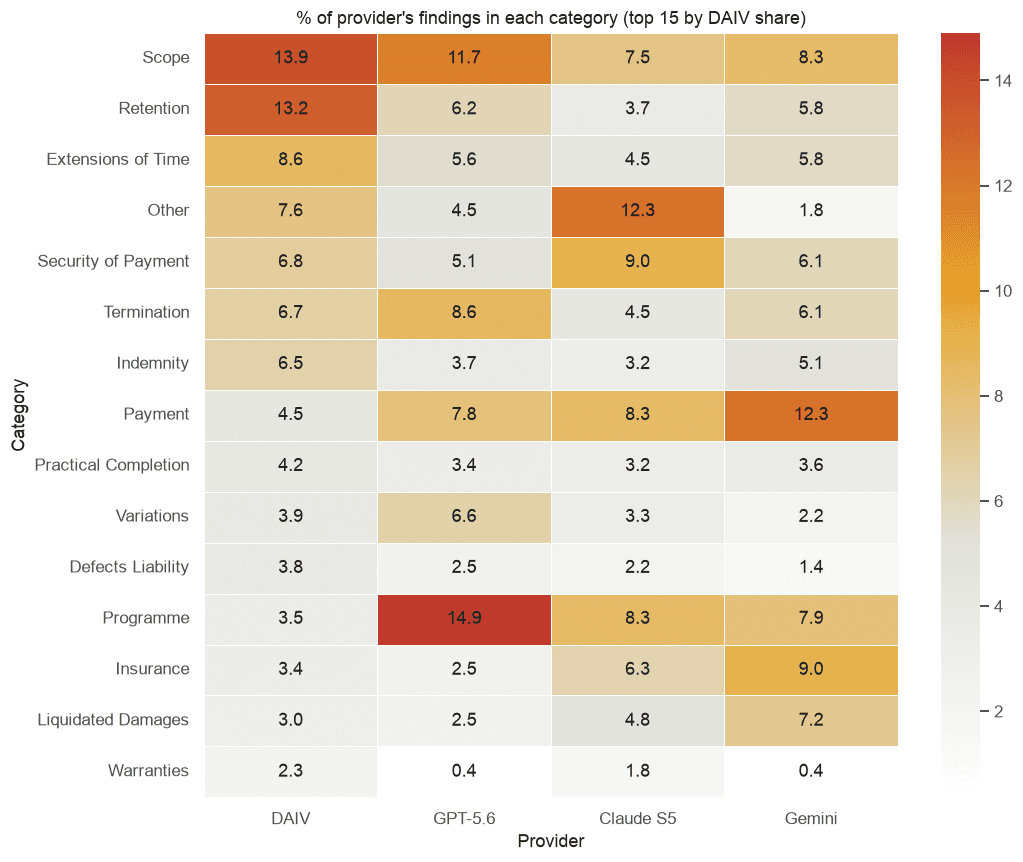
DAIV's higher overall volume makes stable top-category rankings easier to achieve than at Gemini's much lower volume - this isn't purely a consistency difference; it's partly a function of how much each approach surfaces in total.
4. Category-level consistency: lower numbers are better
The category CV heatmap answers: "When this tool tags items in Retention (or Scope, or Payment), does it tag a similar amount every time?"
| Category | DAIV CV | GPT-5.6 CV | Claude S5 CV | Gemini CV |
|---|---|---|---|---|
| Scope | 16% | 30% | 66% | 41% |
| Retention | 11% | 35% | 99% | 102% |
| Extensions of Time | 16% | 40% | 48% | 102% |
| Security of Payment | 24% | 50% | 47% | 85% |
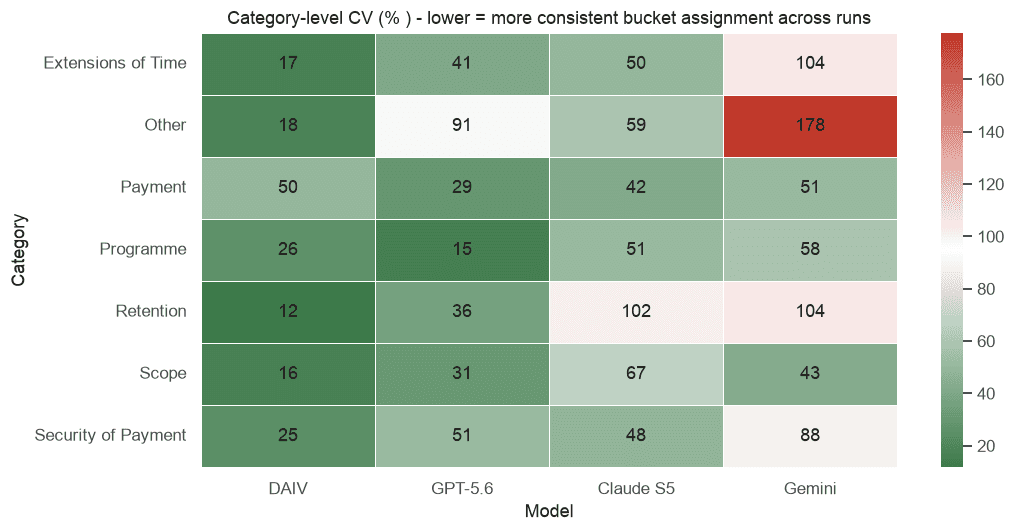
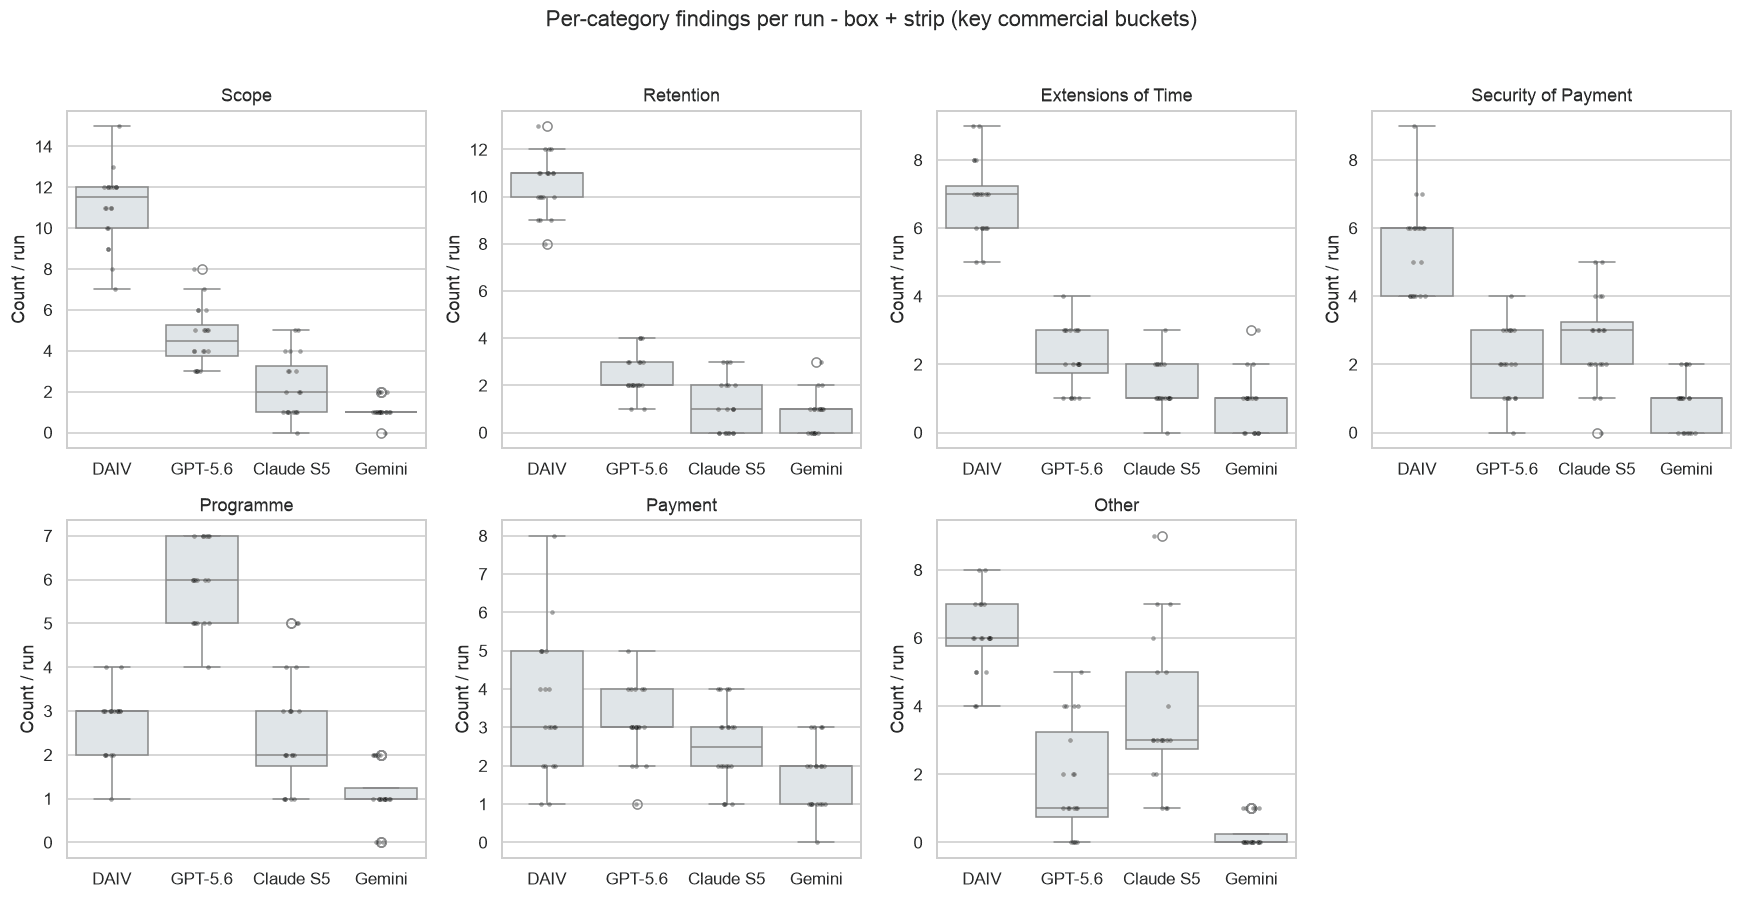
When CV exceeds 100%, the average count is often so low that some runs had zero items in that category and others had a few - the model is intermittently skipping whole category buckets entirely.
GPT-5.6 and Claude S5 sit between DAIV and Gemini on most buckets: more stable than Gemini, but still materially noisier than DAIV on Retention and Extensions of Time.
5. Prompt adherence wasn't perfect - even before reviewing outputs
Several proprietary LLM runs reported different numbers of org benchmarks extracted from the benchmark library PDF (expected: 50).
| Provider | Avg benchmarks extracted | Notes |
|---|---|---|
| DAIV | 50.0 | Stable |
| GPT-5.6 | 50.0 | Stable |
| Claude S5 | 37.6 | Variable |
| Gemini | 45.0 | Range 12–50 across runs |
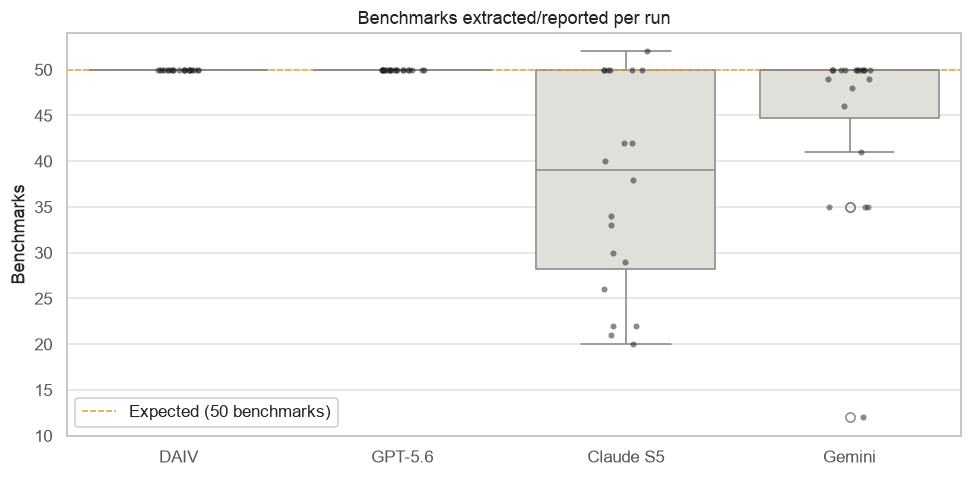
That's an upstream signal: if the model doesn't consistently ingest the org's benchmark library, downstream categorisation and benchmark correlation inherit that noise.
We also saw off-vocabulary category labels in some Gemini runs (e.g. "Working Hours", abbreviated "Security", "Internal" used as a category) - evidence that generic prompts don't always constrain outputs to a controlled taxonomy.
What this does not mean
We want to be precise:
- This is not "LLMs can't scan construction documents." They can - especially when embedded in structured workflows with retrieval, validation, and repeatable pipelines.
- This is not "a better prompt fixes everything." Better prompts help. So do multi-step workflows, tool use, RAG, and human review. We deliberately tested a common minimal pattern.
- This is not a claim about accuracy without a gold standard. We did not manually adjudicate every tagged item in this round. This study measures repeatability, coverage shape, and workflow behaviour - not correctness or fitness for any particular decision.
- We are not attempting to discredit any proprietary models. The study findings do not represent the full capabilities of these proprietary models and extensive experimentation is advised when determining which is best for your use case.
- DAIV is not perfect either. It showed low variance, not zero variance. Structured scans still require human judgement, org context, and proper workflow.
So what should the industry take away?
If your document workflow looks like this:
Download PDF → Upload to ChatGPT/Gemini/Claude → "Analyse this" → Save the answer
…then based on our experiment, you should expect:
- Different item counts on every re-run
- Different category emphasis each time
- Uneven coverage across org-benchmark and legislative tracks
- Category buckets intermittently empty (especially at low overall volume)
That's not a failure of AI in general. It's a predictable outcome of using a general model and a general prompt for a structured, category-driven scan task without the right workflow around it.
A repeatable construction scan workflow needs:
- Repeatability - same document should produce a comparable output
- Org specificity - your benchmark library applied consistently, not just mentioned in a prompt
- Traceability - clause-level references, categories, severity tiers, and source attribution
- Balanced coverage - org-benchmark correlation and legislative attribution handled as distinct tracks
A single chat turn on a PDF doesn't reliably deliver those properties - at least not in the configuration we tested, with the model versions available at the time.
What we're doing next
To those data crunchers reading, we hear you. Some may say this isn't exactly a fair test; one-prompting against an already established pipeline. Well, what happens when we substitute these models into our pipeline and then compare?
DAIV has that capability, so stay tuned for the next one.
Closing thought
AI will keep getting better. Models will get smarter, prompts will get sharper, and tooling will improve. That's good for construction.
But trust in document scanning doesn't come from an impressive demo - it comes from knowing that when your team runs the same PDF twice, they aren't betting the project on a coin flip.
That's the bar we think the industry should hold - whether you use DAIV, an in-house pipeline, or a carefully designed LLM workflow.
Methodology summary
| Element | Detail |
|---|---|
| Runs per provider | 20 |
| Input | 1 construction PDF + 1 org benchmark library PDF |
| Models tested | Gemini 3.1 Pro, Claude Sonnet 5 (Medium), GPT-5.6 Sol (Instant) |
| Proprietary LLM method | Single combined chat prompt (org benchmarks + legislative context) |
| DAIV method | Production scan pipeline (segmentation, benchmark retrieval, legislation RAG) |
| Primary metrics | Total items, severity, track split, category breakdown |
| Consistency metrics | CV, box plots, top-category rank stability |
| Statistical tests | Kruskal–Wallis; Mann–Whitney U vs DAIV (Bonferroni-adjusted) |
Summary statistics
| Provider | Runs | Total (mean) | Total (min–max) | High (mean) | Org benchmark (mean) | Legislation (mean) | CV (total) |
|---|---|---|---|---|---|---|---|
| DAIV | 20 | 79.7 | 73–85 | 44.7 | 59.6 | 20.1 | 3.9% |
| GPT-5.6 | 20 | 39.6 | 32–51 | 18.2 | 32.7 | 4.3 | 11.0% |
| Claude S5 | 20 | 30.0 | 23–39 | 11.4 | 21.2 | 5.2 | 13.9% |
| Gemini | 20 | 13.8 | 10–23 | 6.6 | 11.8 | 1.2 | 23.2% |
References
Statistical methods
- Bonferroni, C. (1936). Teoria statistica delle classi e calcolo delle probabilità. Pubblicazioni del R Istituto Superiore di Scienze Economiche e Commerciali di Firenze, 8, 3–62.
- ISO 5725 (series). Accuracy (trueness and precision) of measurement methods and results.
- Kruskal, W. H., & Wallis, W. A. (1952). Use of ranks in one-criterion variance analysis. Journal of the American Statistical Association, 47(260), 583–621.
- Mann, H. B., & Whitney, D. R. (1947). On a test of whether one of two random variables is stochastically larger than the other. Annals of Mathematical Statistics, 18(1), 50–60.
Applying these methods to NLP / LLM evaluation
- Dror, R., Baumer, G., Shlomov, S., & Reichart, R. (2018). The Hitchhiker's Guide to Testing Statistical Significance in Natural Language Processing. In Proceedings of ACL 2018 (pp. 1383–1392). https://aclanthology.org/P18-1128/
- Card, D., Henderson, P., Khandelwal, U., Jia, R., Mahowald, K., & Jurafsky, D. (2020). With Little Power Comes Great Responsibility. In Proceedings of EMNLP 2020 (pp. 9263–9274). https://aclanthology.org/2020.emnlp-main.745/
- Chang, Y., Wang, X., Wang, J., Wu, Y., Yang, L., Zhu, K., Chen, H., Yi, X., Wang, C., Wang, Y., Ye, W., Zhang, Y., Chang, Y., Yu, P. S., Yang, Q., & Xie, X. (2024). A Survey on Evaluation of Large Language Models. ACM Transactions on Intelligent Systems and Technology, 15(3), Article 39. https://doi.org/10.1145/3641289
- Zheng, L., Chiang, W.-L., Sheng, Y., Zhuang, S., Wu, Z., Zhuang, Y., Lin, Z., Li, Z., Li, D., Xing, E., Zhang, H., Gonzalez, J. E., & Stoica, I. (2023). Judging LLM-as-a-Judge with MT-Bench and Chatbot Arena. In Advances in Neural Information Processing Systems 36 (NeurIPS 2023). https://arxiv.org/abs/2306.05685
LLM output variability
- Atil, B., et al. (2025). Non-Determinism of "Deterministic" LLM System Settings in Hosted Environments. In Proceedings of Eval4NLP 2025 (pp. 140–153). https://doi.org/10.18653/v1/2025.eval4nlp-1.12 (Preprint: arXiv:2408.04667, 2024.)
- Song, Y., Wang, G., Li, S., & Lin, B. Y. (2024). The Good, the Bad, and the Greedy: Evaluation of LLMs Should Not Ignore Non-Determinism. arXiv:2407.10457. https://arxiv.org/abs/2407.10457